
ABS (Automated Ball Strike) System Insight Model Analysis
Modeling and insight around Automated Ball-Strike data — how the machine zone and the challenge system shift pitching, receiving, and hitting value, and what to do about it.
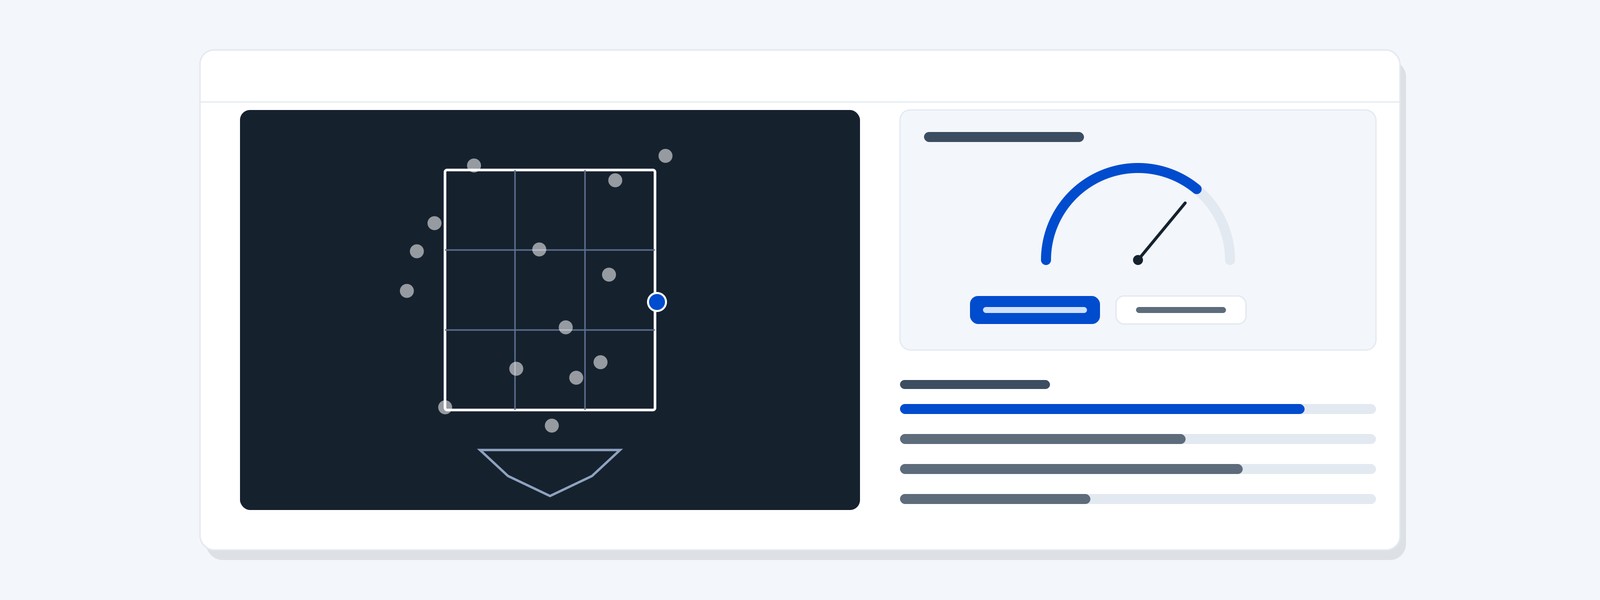
High-fidelity flat vector product mockup in enterprise SaaS marketing style: a strike-zone analytics application window — a central dark charcoal (#16212e) panel with a precise white wireframe strike zone over a home-plate outline and a scatter of small pitch-location dots, a right panel with a challenge-decision card showing a large semicircular gauge and two option buttons, small value bars beneath, exactly one borderline pitch dot and the gauge needle in royal blue (#004cce). Soft pale gray (#f3f6fa) page background; white (#ffffff) panels with thin (#e3e9f1) hairline borders and very subtle drop shadows; slate (#5d6b7b) secondary marks. All text as greeked placeholder bars — no legible words, letters, or numbers. Crisp straight-on geometry, generous spacing, modern and corporate, no people, no photographs What it does
The Automated Ball-Strike system doesn’t just change who calls a pitch — it quietly reprices skills across a roster. A machine-defined zone with a challenge system changes what the effective strike zone is, what a catcher’s receiving is worth, which edge pitches keep their value, and when it’s rational to spend a challenge. This build is a modeling framework for all of it.
It starts with the zone itself: a precise geometric model of the ABS zone as defined — batter-height dependent, measured at fixed depth — compared against the empirical, probabilistic zones human umpires actually called. The difference between those two surfaces is a map of repriced pitches: locations that used to be strikes and aren’t, locations that were coin-flips and are now certainties. On top of that sit the strategic layers: how pitch mixes and target locations should shift under the machine zone; what happens to framing value — the skill most affected — under full ABS versus a challenge format; and a decision model for the challenge system itself, treating challenges as a scarce resource to be spent by expected value: game state, leverage, confidence in the call, challenges remaining.
The output is insight a staff can act on — reports and interactive views that show where the value moved, by how much, and for whom on the roster it matters most.
Who it’s for
Run-prevention and pitching-strategy groups planning for ABS environments; catching coordinators who need to know what receiving is worth under each format; front offices pricing catchers and command pitchers whose value shifts with the zone; and player development staffs deciding what to teach in the leagues where ABS already lives.
The quantitative methods
Probabilistic modeling of called-strike surfaces from historical umpire data; geometric zone analysis under ABS rules; physics-informed treatment of ball-tracking trajectories at the decision plane; expected-value simulation for challenge policy under game state and leverage; and value-attribution modeling for receiving, command, and edge-pitch skill under alternative zone regimes.
Example outcomes
Representative outcomes: a challenge policy — when to spend, when to hold — expressed in the same expected-run language as any other in-game decision; pitcher-by-pitcher maps of where the machine zone gives and takes; a receiving-value outlook that informs catcher acquisition before the market reprices; and development guidance grounded in the zone the next generation will actually pitch to.
From sample to engagement
Zone rules and challenge formats are still moving — which is precisely why this is modeling work rather than a product. An engagement pins the framework to the rule set your league is actually adopting, runs it against your tracking data, and delivers the strategic read before your opponents finish arguing about the calls.